Creating an Interactive Engineering Diagram App in JavaScript

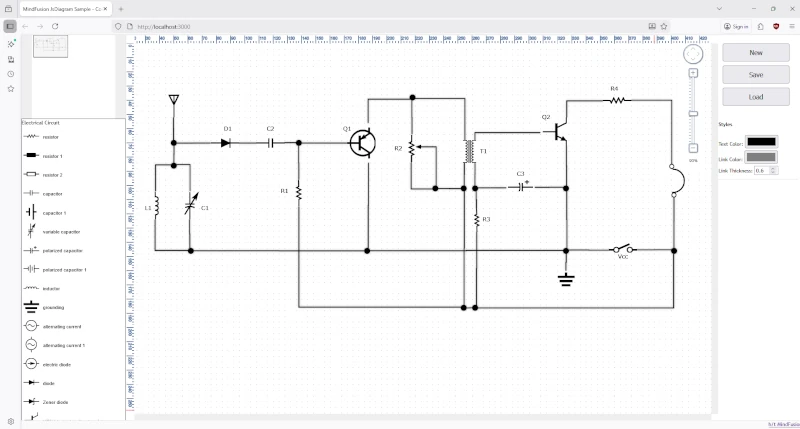
In this post, we’ll walk through the process of building a web-based electrical diagram application. This tool allows users to create, modify, and save circuit and home appliance diagrams. We’ll use the.Diagramming for JavaScript, and its ability to support SVG images in modes, various arrow head shapes on links, save and load of flowcharts to/from various formats.

The final application will feature:

  • A diagram view that supports pan and zoom.
  • A palette of pre-defined SVG nodes representing various engineering components, separated into logical sections.
  • The ability to save the current diagram to a JSON file and load it back.
  • Real-time style customization for text, links, and more.
A circuit schema created with MindFusion Diagramming library for JavaScript

Continue reading

Building a Custom-Styled WPF Virtual Keyboard: A How-To Guide

Creating a custom user interface often requires tailoring components to fit your application’s specific design language. In this guide, we’ll walk you through how to build and style a WPF virtual keyboard from the ground up, using the powerful MindFusion’s WPF Virtual Keyboard component. The result will be a beautiful, resizable keyboard with custom icons, animations, and a clean, maintainable structure.

A custom virtual keyboard embedded in a WPF application

Continue reading

Save and Load Part of Diagram Data to/from JSON Files

In this blog post we will demonstrate how you can implement methods that save and load part of the information that a diagram renders into JSON format. The Diagram class has built-in toJson and fromJson methods. They serialize completely the diagram with every detail so you can restore it completely, exactly the way you see it. What we are going to do is write custom save and load methods that use only part of the information – namely the size and location of nodes and links as well as their text.

Continue reading

Custom Grid Drawing in Charting for JavaScript

In this blog post we will look in short at the steps to build this JavaScript area chart with custom grid:

The line chart uses DateTimeSeries for the data and a standard GridType for the major grid lines. The auxiliary grid lines among them are made with custom drawing: we will discuss in details the code for that.

The sample uses MindFusion Charting library for JavaScript, which also supports TypeScript.

You can see the sample online at https://mindfusion.dev/samples/javascript/chart/CustomGrid/DateTimeSeries.html

Continue reading

Customizing Diagram Link Shape-s in JavaScript and React

In this blog post we will look at 3 different ways of customizing diagram links. They are:

  • Drawing one ShapeNode in the middle of the link.
  • Drawing a rectangle in the middle of a link.
  • Drawing a ShapeNode at conjunction points.

The following image illustrates DiagramLink s created by each of the three methods.

Continue reading