Right click on a node to create a subordinate. Click on an empty area to create a top-level node. Use the ID field in the WP Editor to assign a unique ID to your chart and adjust its properties.
Do not forget to save your work once done building your org chart.
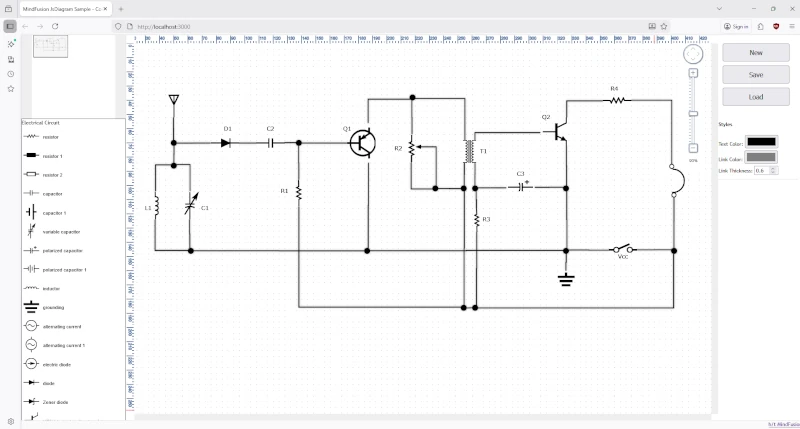
In this post, we’ll walk through the process of building a web-based electrical diagram application. This tool allows users to create, modify, and save circuit and home appliance diagrams. We’ll use the.Diagramming for JavaScript, and its ability to support SVG images in modes, various arrow head shapes on links, save and load of flowcharts to/from various formats.
The final application will feature:
A diagram view that supports pan and zoom.
A palette of pre-defined SVG nodes representing various engineering components, separated into logical sections.
The ability to save the current diagram to a JSON file and load it back.
Real-time style customization for text, links, and more.
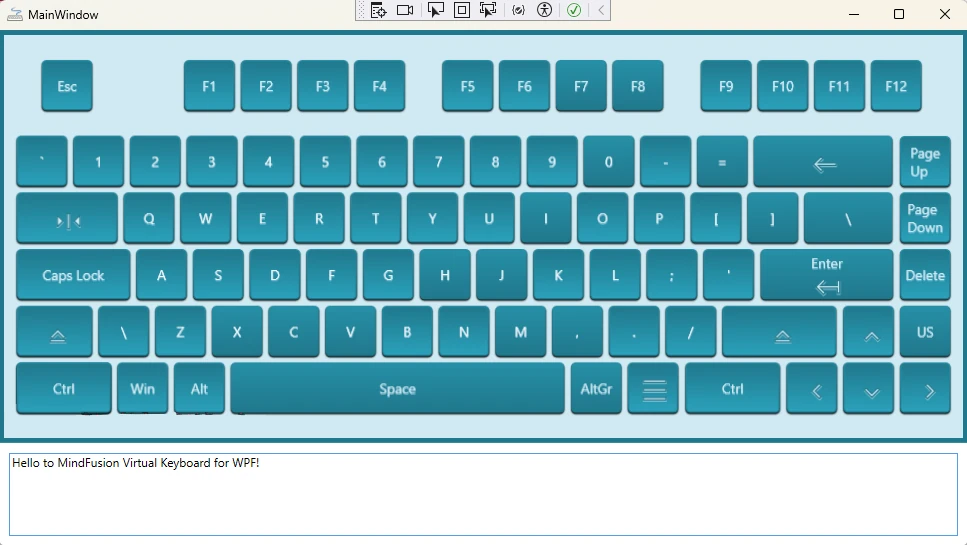
Creating a custom user interface often requires tailoring components to fit your application’s specific design language. In this guide, we’ll walk you through how to build and style a WPF virtual keyboard from the ground up, using the powerful MindFusion’s WPF Virtual Keyboard component. The result will be a beautiful, resizable keyboard with custom icons, animations, and a clean, maintainable structure.
The Fishbone or Ishikawa diagram is a powerful tool for cause-and-effect analysis. While users can build them manually using a diagram editor, it’s often more efficient to generate them programmatically from a predefined data set. This article walks through the process of creating a complete fishbone diagram from scratch using JavaScript and the MindFusion.Diagramming API.
We are excited to announce the release of JsPack 2025.R2! This update brings a host of new features and improvements to our Diagramming, Scheduling, and Virtual Keyboard components. Here’s a look at what’s new.