In this article we look at the steps required to build this minimal JavaScript diagramming application:
The application uses MindFusion JavaScript Diagram library and allows the user to create various flowchart shapes with drag and drop, customize their color and edit text. Users can create links and specify whether links have arrowheads. Once ready, they can save the current diagram and load it when needed.
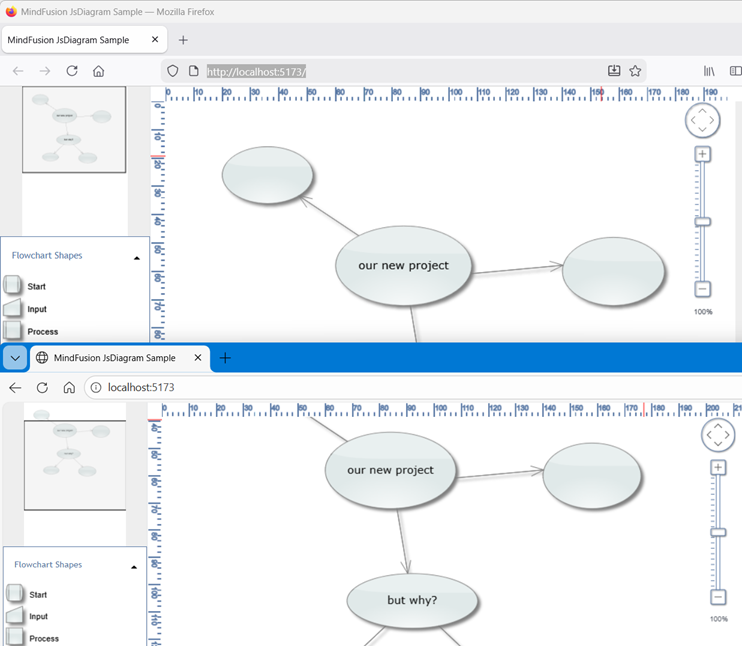
In a world that thrives on remote work and instant communication, building collaborative tools has become more relevant than ever. Following up on an older post where we built a collaborative mind map with ASP.NET MVC and SignalR, this article will guide you through creating a similar real-time, interactive diagramming application using a modern JavaScript stack: Node.js, Express, Socket.IO, and MindFusion’s powerful JavaScript Diagram library.
To ensure consistency across all clients, we’ll implement a server-authoritative architecture. This means our Node.js server will maintain a single, master instance of the diagram. This instance acts as the single source of truth.
The workflow is as follows:
A new user connects to the server.
The server immediately sends a complete snapshot of its current diagram to the new user.
When a user makes a change (e.g., creates a node), their client sends a small, specific event (a “fine-grained” event) to the server.
The server updates its master diagram instance based on this event.
The server then broadcasts the same event to all other connected clients, who each update their local diagrams accordingly.
This model is efficient and robust, preventing clients from falling out of sync.
Setting Up the Backend with Node.js and Socket.IO
Our server is built with Express and Socket.IO. The most important part is that we create an instance of the MindFusion Diagram object directly on the server. This is possible because the core data model of the library is isomorphic and does not depend on a browser environment.
Here’s a look at the key parts of our server.js file:
// server.js
import { Diagram, Shape } from '@mindfusion/diagramming';
import { Rect } from '@mindfusion/drawing';

// 1. Server-side diagram instance is our "source of truth"
const serverDiagram = new Diagram();

// 2. We can create a default diagram for the first user
const node1 = serverDiagram.factory.createShapeNode(10, 10, 30, 30);
node1.text = "Hello";
node1.id = "node1";
// ... and so on

// Helper function to find items in the server's diagram
function findNode(id) {
    return serverDiagram.nodes.find(n => n.id === id);
}

// 3. Handle new connections
io.on('connection', (socket) => {
    console.log('A user connected:', socket.id);

    // 4. Immediately send the full diagram to the new client
    socket.emit('load', serverDiagram.toJson());

    // 5. Handle incoming events from clients
    socket.on('nodeCreated', (data) => {
        // Update the server's diagram first
        const node = serverDiagram.factory.createShapeNode(data.x, data.y, data.width, data.height);
        node.id = data.id;
        node.text = data.text;
        node.shape = Shape.fromId(data.shape);

        // Then broadcast the event to other clients
        socket.broadcast.emit('nodeCreated', data);
    });

    // ... handlers for nodeModified, linkCreated, etc.
});
This setup ensures our server always holds the master state.
Building the Frontend with MindFusion’s Diagram Library
On the client-side, our index.js file is responsible for rendering the diagram and communicating with the server.
1. Connecting and Receiving the Initial State:
The client connects to the Socket.IO server and listens for the load event. When it receives this event, it loads the full diagram JSON sent by the server.
// index.js
document.addEventListener("DOMContentLoaded", function () {
    socket = io("http://localhost:3000");

    diagram = DiagramView.create(document.getElementById("diagram")).diagram;

    // Listen for the 'load' event from the server
    socket.on('load', (data) => {
        diagram.fromJson(data);
    });

    // ... other event listeners
});
2. Sending Changes to the Server:
We attach listeners to the diagram’s events, such as nodeCreated. When a user creates a node, the handler fires, packages the relevant data into a simple model, and emits it to the server.
// index.js

// Attach the event listener
diagram.nodeCreated.addEventListener(onNodeCreated);

// The event handler function
function onNodeCreated(sender, args) {

    const node = args.node;
    // Assign a unique ID before sending
    if (!node.id) {
        node.id = socket.id + new Date().valueOf();
    }

    const r = node.bounds;
    const model = {
        id: node.id,
        text: node.text,
        shape: node.shape.id,
        x: r.x,
        y: r.y,
        width: r.width,
        height: r.height
    };

    // Emit the fine-grained event to the server
    socket.emit('nodeCreated', model);
}
3. Receiving Changes from the Server:
Finally, the client needs to handle incoming broadcasted events from the server. This is the counterpart to the server’s socket.broadcast.emit.
This code snippet creates a local ShapeNode programmatically when another client has drawn it interactively. The full sample project contains corresponding handlers for other node and link events.
Conclusion
By combining the powerful rendering capabilities of the MindFusion.Diagramming for JavaScript library with a server-authoritative model using Node.js and Socket.IO, we’ve built a robust and efficient collaborative application. This architecture ensures state consistency while minimizing the amount of data sent over the wire for real-time updates.
The Fishbone or Ishikawa diagram is a powerful tool for cause-and-effect analysis. While users can build them manually using a diagram editor, it’s often more efficient to generate them programmatically from a predefined data set. This article walks through the process of creating a complete fishbone diagram from scratch using JavaScript and the MindFusion.Diagramming API.
A frequent requirement for many kinds of diagrams is to keep their underlying graphs acyclic. If your application lets users draw diagrams interactively, you could prevent forming a cycle by rejecting new link between a pair of nodes that are already connected by a path.
This post demonstrates MindFusion.Diagramming API functionality that let you traverse connected diagram elements (following incident edges and adjacent nodes in graph-theory terminology). A diagram is treated as directed graph, where each node exposes incomingLinks and outgoingLinks collection properties, and respectively each link exposes origin and destination node properties. Thus the classic breadth-first search algorithm can be implemented like this for a diagram, with the callback parameter being invoked for each node, also reporting visit order and distance from initial node (as in length of shortest path in the graph):