MindFusion has just released a beta version of its Diagramming for Android library. Here is an overview of the new features:
Tree map layout
Tree maps represent hierarchies by nesting child nodes within their parents, where the areas of leaf nodes are proportional to their Weight values. Unlike other layout algorithms, TreeMapLayout expects hierarchies to be defined via grouping or containment (see AttachTo method and ContainerNode class), and will ignore any links in the diagram. The diagram area covered by the topmost nodes in a hierarchy is specified via the LayoutArea property. By default, the layout tries to keep the ratio of node sides as close as possible to one.

The tree map layout.
Decision flowchart layout
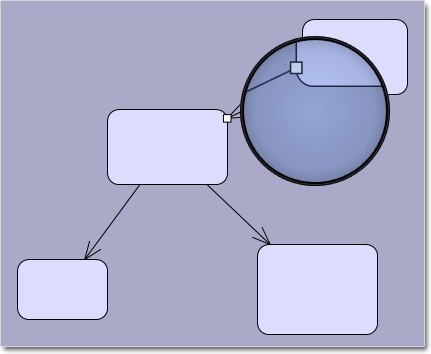
DecisionLayout arranges simple flowcharts consisting of decision boxes with up to three outgoing links per node and activity boxes with a single outgoing link per node. The nodes are arranged in columns and rows, whose distance depends on the HorizontalPadding and VerticalPadding property values. When links share the same row or column, they are placed at a distance specified via LinkPadding. The layout arranges nodes recursively starting from StartNode.

The decision flowchart layout.
Composite nodes
The CompositeNode class implements nodes whose appearance can be defined via composition of components and layout containers. You can load the content of a composite node from XML files similar to .NET Xaml templates and Android XML layouts. This initial release includes layout containers such as StackPanel and GridPanel, and read-only components like ImageComponent, TextComponent, ShapeComponent, BorderComponent. Future versions will add interactive components like buttons and text editors.
Resize multiple nodes
Now you can resize multiple selected nodes simultaneously. To enable that, set the AllowMultipleResize property to true. When enabled, dragging a corner or side adjustment handle of any node resizes all nodes in the selection. The operation will be cancelled for all nodes if any of them does not accept its new size, e.g. if it’s smaller than minimum allowed node size.
Binary serialization
Use the new saveTo and loadFrom methods, which implement serialization using Java Serializable interface. In addition, saveToString now creates base64-encoded string from a byte stream containing the binary-serialized form of the diagram. Binary format requires less memory and is much faster to process, which makes it more suitable for saving the diagram as part of Android Activity state.
Miscellaneous
- Layout algorithms now automatically resize diagram’s Bounds if it’s not large enough to fit the
arranged content. - LinkLabels are now copied by DiagramLink copy constructor and clipboard methods.
The new version is available for download from the following link:
Download Diagramming for Android, V1.1 Beta
If you require technical support, please use the forum or write us at support@mindfusion.dev. A help desk is also available. Providing fast and competent technical support is among the priorities of MindFusion. We answer most support inquiries within hours of receiving them.
About Diagramming for Android: A native Java class library, which provides your Android application with a powerful set of features for creating, customizing and displaying flowcharts, genealogy trees, class hierarchies, networks, algorithms and much more. The component offers a rich choice of predefined shapes, many pen and brush options as well HTML-like formatting of text. Diagram nodes can hold text as well images, can be semi-transparent and support glass reflection effects. The component offers various automatic layout algorithms and a rich user interaction model, which supports zoom, scroll, alignment guides and more. You can read the features list at the features web page of the component. For pricing and licenses check this link.