
In enterprise environments like Manufacturing Execution Systems (MES) and Fleet Management, the “Mission Control” dashboard is the holy grail. It provides the ability to visualize hundreds of resources—machines, personnel, or vehicles—across a multi-day timeline while maintaining a clean, hierarchical structure.
In this post, we’ll explore how to use MindFusion Scheduling for Java Swing to create an enterprise-grade resource manager.
The Challenge: Visualizing High-Volume Data
Enterprise applications often struggle with visual clutter. Users need to see the “big picture” (e.g., Factory Floor uptime) while retaining the ability to drill down into specifics (e.g., individual Machine maintenance).
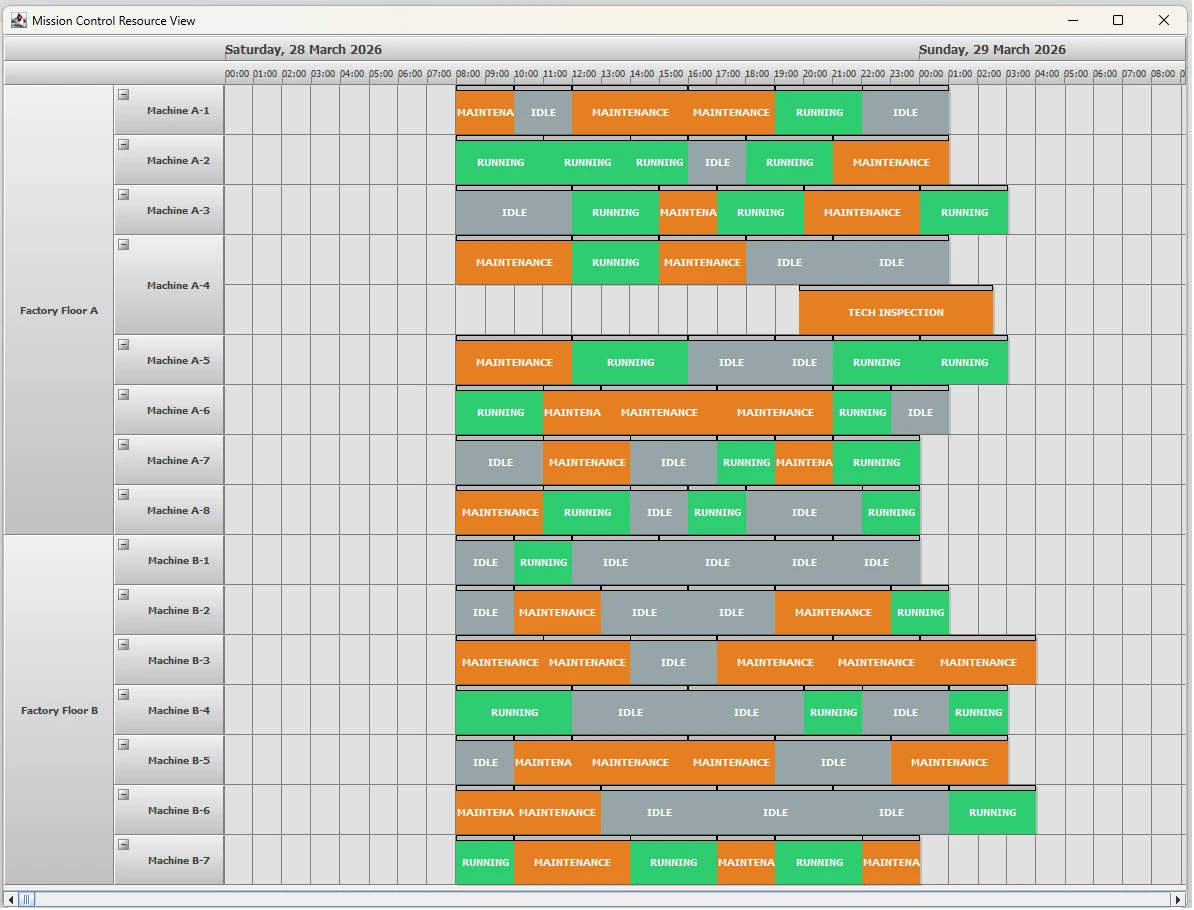
The Feature: The “Mission Control” Resource View
Our “Mission Control” demo highlights several valued enterprise features:
- Expandable/Collapsible Rows: Handle hundreds of resources by grouping them into logical departments or zones.
- Hierarchical Grouped Headers: Visualize parent-child relationships (Factory Floor -> Machine) with distinct branding.
- Color-Coded Status Blocks: Instant visual recognition of “Running” (Green), “Maintenance” (Orange), and “Idle” (Gray) states.