
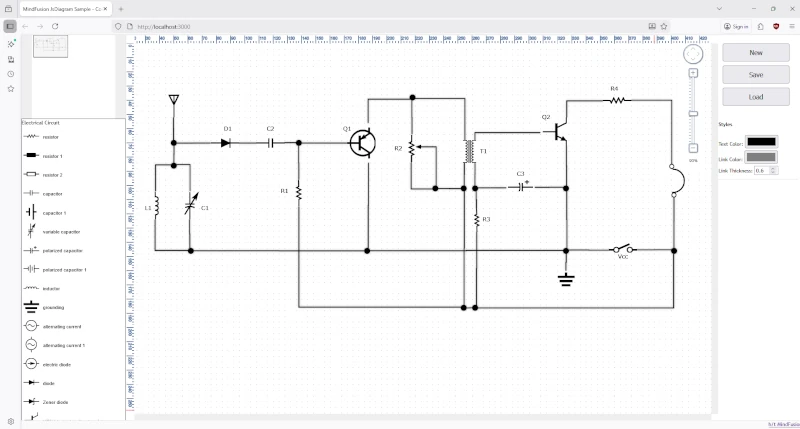
In this post, we’ll walk through the process of building a web-based electrical diagram application. This tool allows users to create, modify, and save circuit and home appliance diagrams. We’ll use the.Diagramming for JavaScript, and its ability to support SVG images in modes, various arrow head shapes on links, save and load of flowcharts to/from various formats.
The final application will feature:
- A diagram view that supports pan and zoom.
- A palette of pre-defined SVG nodes representing various engineering components, separated into logical sections.
- The ability to save the current diagram to a JSON file and load it back.
- Real-time style customization for text, links, and more.
Project Setup
First, let’s set up the project structure. We need a simple web server to serve our HTML, JavaScript, and asset files.
File Structure:
/
|-- index.html
|-- index.js
|-- server.js
|-- package.json
|-- icons/
|   |-- resistor.svg
|   |-- capacitor.svg
|   |-- ... (and other component SVGs)
|-- scripts/
|   |-- diagramming.js
|   |-- ... (MindFusion library files)
1. The Server (server.js)
We’ll use a basic Express.js server with nodemon and reload for live-reloading, which is great for development.
// server.js
const express = require('express');
const open = require('open');
var reload = require('reload')

const app = express();
const port = 3000;

app.use(express.static(__dirname));

reload(app).then(function () {
  app.listen(port, function () {
   console.log(`Server listening at http://localhost:${port}`);
  })
}).catch(function (err) {
  console.error('Reload could not start, could not start server/sample app', err)
})
2. Dependencies (package.json)
Our package.json defines the dependencies and a convenient start script.
{
  "name": "engineering-diagram-app",
  "version": "1.0.0",
  "scripts": {
    "start": "start http://localhost:3000 && nodemon -e js,html server.js"
  },
  "dependencies": {
    "express": "^4.17.1",
    "open": "^8.4.0"
  },
  "devDependencies": {
    "nodemon": "^3.1.10",
    "reload": "^3.4.2"
  }
}
To get started, run npm install to download the dependencies, then npm start to launch the server. The application shall be accessible on port 3000 at localhost.
Building the UI (index.html)
The HTML file lays out the different components of our application. We define div and canvas elements that will host the main diagram, an overview panel, a palette, a zoom control, and the ruler component. The size and position of the elements determine the size and position of the diagram controls – that’s how the diagram library renders its UI.
<!-- index.html -->
<div id="content">
    <div style="... width: 250px ...">
        <!-- The Overview component -->
        <canvas id="overview" width="200" height="200"></canvas>
        <!-- The Palette component -->
        <div id="palette"></div>
    </div>
    <div id="ruler">
        <!-- The DiagramView component -->
        <canvas id="diagram" width="2100" height="2100"></canvas>
    </div>
    <!-- The ZoomControl component -->
    <div style="... top: 20px; right: 35px ...">
        <canvas id="zoomer"></canvas>
    </div>
</div>
We also include input controls for style customization, such as color pickers for text and links, and a number input for link thickness. When the value of an input control changes, the change is reflected on the given properties of the diagram elements.
Initializing the Diagram (index.js)
All our application logic resides in index.js. We start by initializing the DiagramView and Diagram objects when the DOM is loaded.
// index.js
var DiagramView = MindFusion.Diagramming.DiagramView;
var Diagram = MindFusion.Diagramming.Diagram;

var diagram = null;

document.addEventListener("DOMContentLoaded", function () {
    // create a DiagramView component that wraps the "diagram" canvas
    var diagramView = DiagramView.create(document.getElementById("diagram"));
    diagram = diagramView.diagram;
    diagram.allowUnconnectedLinks = true;

    // ... other initial settings ...
});
We need to get the DOM elements that represent the diagram controls and for that we use the getElementById method. Then we call the respective diagram methods to create the objects.
Creating a Rich Palette with SVG Nodes
The Palette control is crucial for a great user experience. Our initPalette function populates the palette with different categories of DiagramItem instances that can be dragged and dropped. They are separated in groups and the diagram API allows us to specify for each section if it appears initially expanded or collapsed.
1. SVG Nodes:
We use SvgNode to create nodes from our external SVG files. We iterate through a list of filenames and create a node for each, adding it to the “Electrical Circuit” or “Home Appliances” category.
// index.js
function initPalette(palette) {
    var SvgNode = MindFusion.Diagramming.SvgNode;
    var SvgContent = MindFusion.Diagramming.SvgContent;

    palette.addCategory("Electrical Circuit");
    var shapeFileNames = ["resistor.svg", "capacitor.svg", "inductor.svg", ...];
    var elCircuitNames = ["resistor", "capacitor", "inductor", ...];

    for (var i = 0; i < shapeFileNames.length; ++i) {
        var node = new SvgNode(diagram);
        node.transparent = true;

        var svg = new SvgContent();
        svg.parse("icons" + shapeFileNames[i]);
        node.content = svg;
        palette.addItem(node, "Electrical Circuit", elCircuitNames[i]);
    }
    // ... similar loop for "Home Appliances" ...

        // expand the first accordion item (Electrical Circuit category)
	palette.collapseItems(palette.items.item(2));
	palette.expandItems(palette.items.item(3));
	palette.expandItems(palette.items.item(0));
}
Note that the DiagramNode-s are created transparent with the help of the same-name property.
2. Link Nodes:
We can also add pre-styled links to the palette. Here, we create several types of electrical connectors.
// index.js -> initPalette
palette.addCategory("Electrical Connectors");
var linkHeadShapes = ["", "Circle", "Triangle"];

for(var i = 1; i <= linkHeadShapes.length; i++)
{
    var link = new MindFusion.Diagramming.DiagramLink();
    link.headShape = linkHeadShapes[i-1];
    // ... other styling ...
    palette.addItem(link, "Electrical Connectors", "connector " + i);
}
The diagram links by default are created only between nodes. In order to have links freely on the diagram we need to set the allowUnconnectedLinks property to true:
// index.js -> settings for the diagram

diagram.allowUnconnectedLinks = true;
Save and Load Functionality
To persist users’ work, we provide “Save” and “Load” buttons.
Saving a Diagram:
The onSaveClick function serializes the diagram’s state into a JSON string using diagram.toJson(). It then uses the browser’s File System Access API (showSaveFilePicker) to let the user save the JSON to a local file.
// index.js
async function onSaveClick() {
    const json = diagram.toJson();

    if (window.showSaveFilePicker) {
        const handle = await window.showSaveFilePicker({
            suggestedName: 'diagram.json',
            types: [{
                description: 'JSON Files',
                accept: { 'application/json': ['.json'] },
            }],
        });
        const writable = await handle.createWritable();
        await writable.write(json);
        await writable.close();
    }
    // ... fallback for older browsers ...
}
Loading a Diagram:
Conversely, onLoadClick allows the user to select a JSON file, reads its text content, and uses diagram.fromJson() to restore the diagram state.
// index.js
async function onLoadClick() {
    if (window.showOpenFilePicker) {
        const [handle] = await window.showOpenFilePicker(/* ... */);
        const file = await handle.getFile();
        const content = await file.text();
        diagram.fromJson(content);
    }
    // ... fallback for older browsers ...
}
Note something important: the .fromJson() method expects a plain string as input, you should not parse the JSON beforehand.
Loading the Initial Diagram
To provide a default view, we automatically load a diagram from a diagram.json file on startup. We use the fetch API to get the file content as a string and load it using the diagram’s fromJson method.
// index.js, inside DOMContentLoaded
fetch('diagram.json')
    .then(response => response.text())
    .then(data => {
        diagram.fromJson(data);
    })
    .catch(error => {
        console.error('Error loading diagram.json:', error);
    });
Dynamic Style Customizations
Finally, we empower users to customize the look of their diagrams. We have UI controls for text color, link color, and link thickness.
Event listeners on these controls update default style variables and apply changes to the currently selected items in the diagram.
// index.js
const linkColorPicker = document.getElementById('linkColorPicker');

linkColorPicker.addEventListener('change', (event) => {
    defaultLinkStrokeColor = event.target.value;
    // Apply to all selected links
    diagram.selection.links.forEach(link => {
        link.stroke = defaultLinkStrokeColor;
        link.headStroke = defaultLinkStrokeColor;
    });
});
Furthermore, we use the diagram’s nodeCreated and linkCreated events to ensure that any new items drawn by the user automatically get the currently selected default styles.
// index.js
diagram.linkCreated.addEventListener(
    (sender, args) =>
    {
        args.link.stroke = defaultLinkStrokeColor;
        args.link.strokeThickness = defaultStrokeThickness;
        // ... and so on
    });
Source Code Download
Interactive Electrical Circuit Diagram App in JavaScript – Full Source Code Download
Conclusion
With MindFusion.Diagramming for JavaScript, we’ve built a feature-rich engineering diagram application with a surprisingly small amount of code. We’ve seen how to set up a project, create a palette of complex SVG nodes, handle serialization to and from JSON, and implement dynamic styling. This foundation can be easily extended with more components, features, and integrations.