
We are excited to announce the Developer Preview of the upcoming MindFusion JavaScript Dashboard Library! Designed from the ground up for performance, visual elegance, and developer flexibility, the library empowers developers to build interactive Business Intelligence (BI) dashboards, executive summaries, and analytical web apps with ease.
Alongside this preview, we have released a complete, interactive BI Dashboard showcase (bi_demo) featuring our new modern dark theme, real-time gauges, transactional grids, and financial candlestick charts.
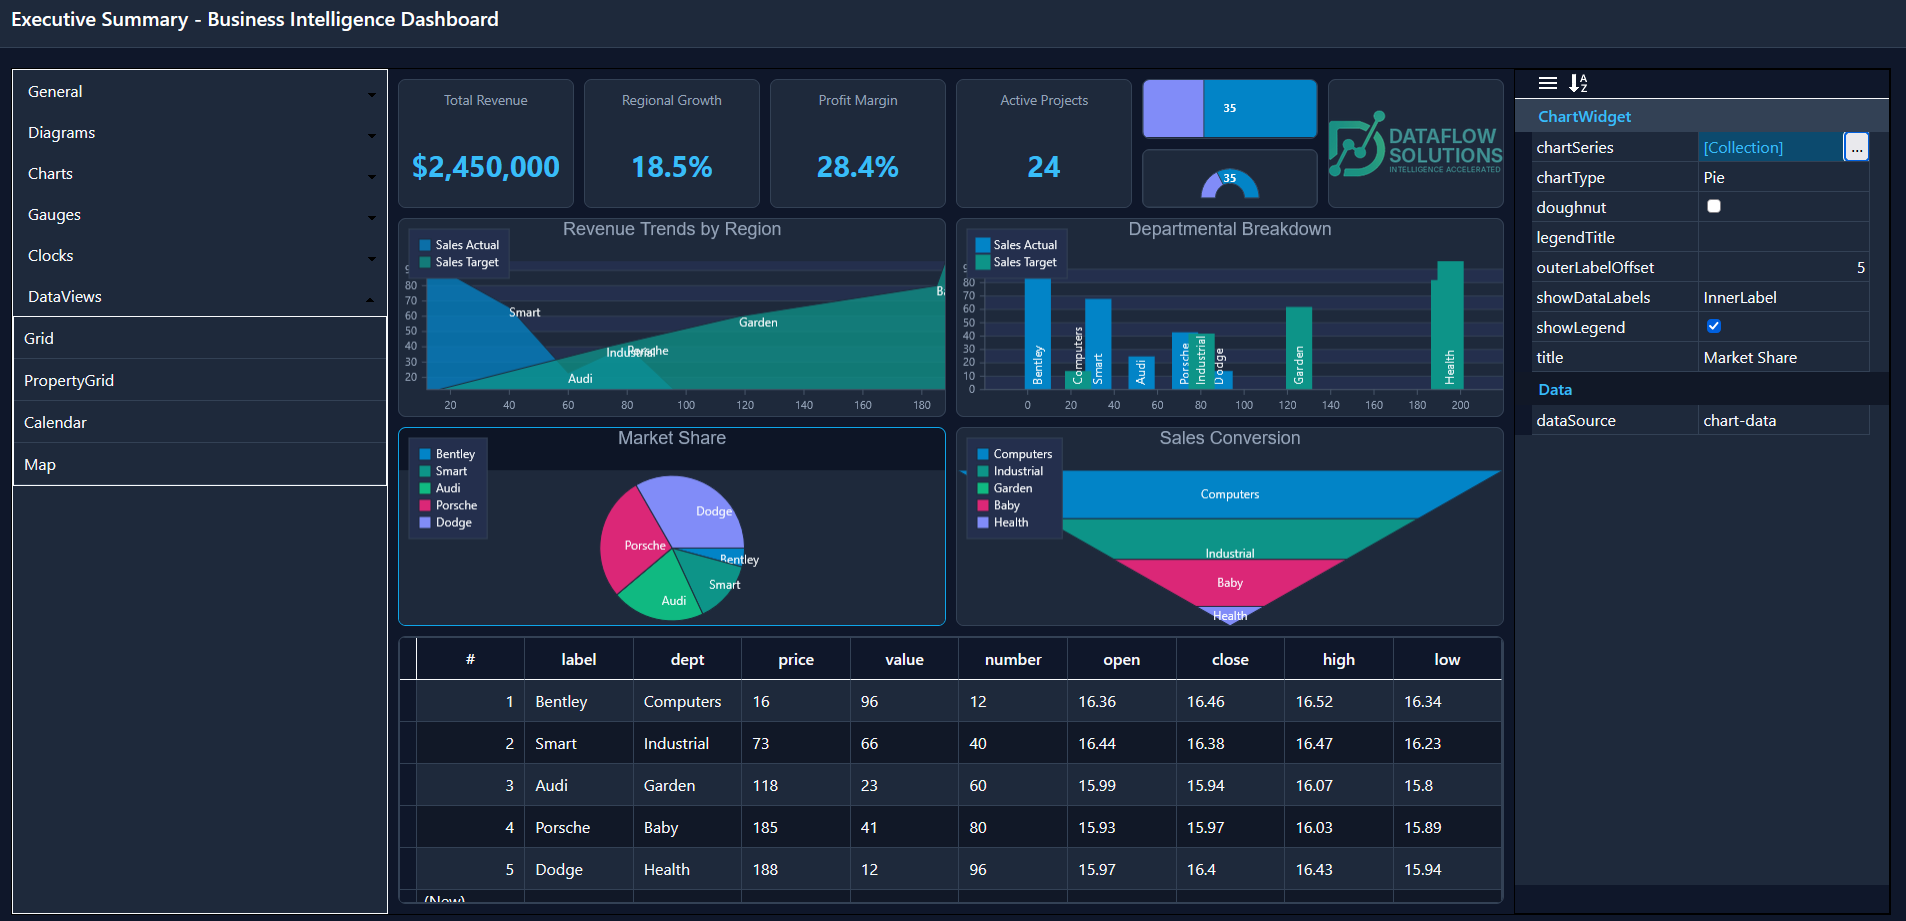
Key Highlights of the Dashboard Library
1. Declarative Data Binding & Dynamic Series
Connecting your visualizations to live data has never been simpler. The dashboard framework introduces declarative DataSource providers that integrate directly with JSON feeds and REST APIs. Widgets bind seamlessly to data paths and dimension mappings, automatically staying synchronized with your underlying business data.
2. Advanced Financial Visualizations
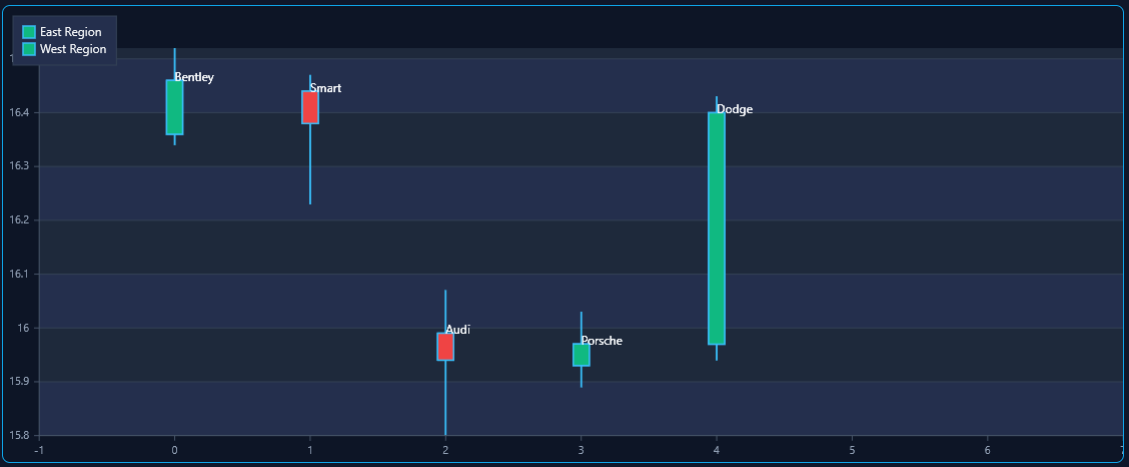
Modern analytics demand sophisticated financial rendering. The newly enhanced Candlestick Chart supports distinct bullish (rising) and bearish (falling) color schemes, intuitive dimension mapping (Open, Close, High, Low), and high-contrast wicks that stand out crisply against dark and light backgrounds alike.
3. Unified Widget Architecture
Rather than managing disparate charts and layout components separately, MindFusion Dashboard provides a unified grid-based canvas. You can effortlessly assemble:
- KPI Cards: Formatted with currency, percentage, and localized number formats via standard ECMAScript Internationalization (
Intl). - Precision Gauges: Horizontal linear meters, radial dials, and semicircle gauges with custom scales and targets.
- Multi-Dimensional Charts: Area, bar, column, line, pie, and sales conversion funnel charts.
- Transactional Data Grids: Deep-dive tables with sorting, grouping, and record details.
- Diagram Overviews: Embedded process flows, workflow diagrams, and network layouts.
4. Centralized Pure CSS Theming
Styling is completely decoupled from your application logic. Through the centralized ThemeManager and pure CSS variables, you can switch between Modern Dark and Modern Light themes in a single call—or customize every brush, stroke thickness, font, and background to match your corporate brand identity.
5. Live Runtime Property Grid
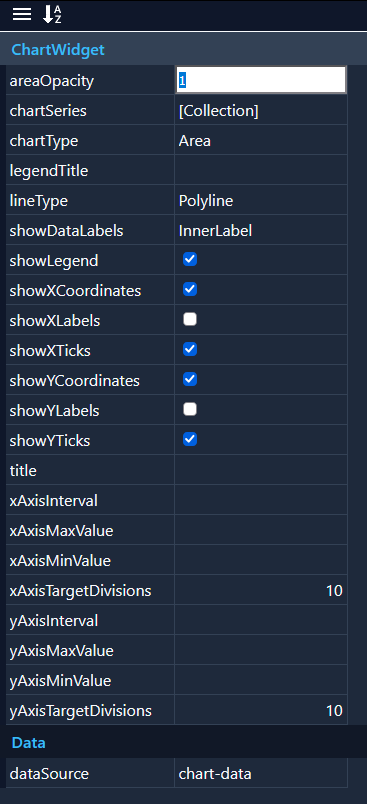
Fine-tune visualizations on the fly! The integrated Property Grid allows runtime inspection and dynamic editing of widget properties, chart dimensions, brush colors, and layout metrics without reloading the page.
Try the Developer Preview Today
The Developer Preview packages and the full bi_demo sample are now available for evaluation. We invite you to explore the source code, test the widgets with your own datasets, and share your feedback with our engineering team as we prepare for the official 1.0 release.
Download Developer Preview (ZIP)
CSS Styling for Dashboards Sample Page
Have questions, suggestions, or feature requests? Join the discussion on the MindFusion Community Forum or reach out directly to our support team at support@mindfusion.eu.