
In this blog post we will create a product inventory and customer satisfaction dashboard in pure JavaScript with a data grid that spans over 10 000 rows and includes real-time bar chart and a KPI gauge. The data is generated dynamically. Here is the ready dashboard:
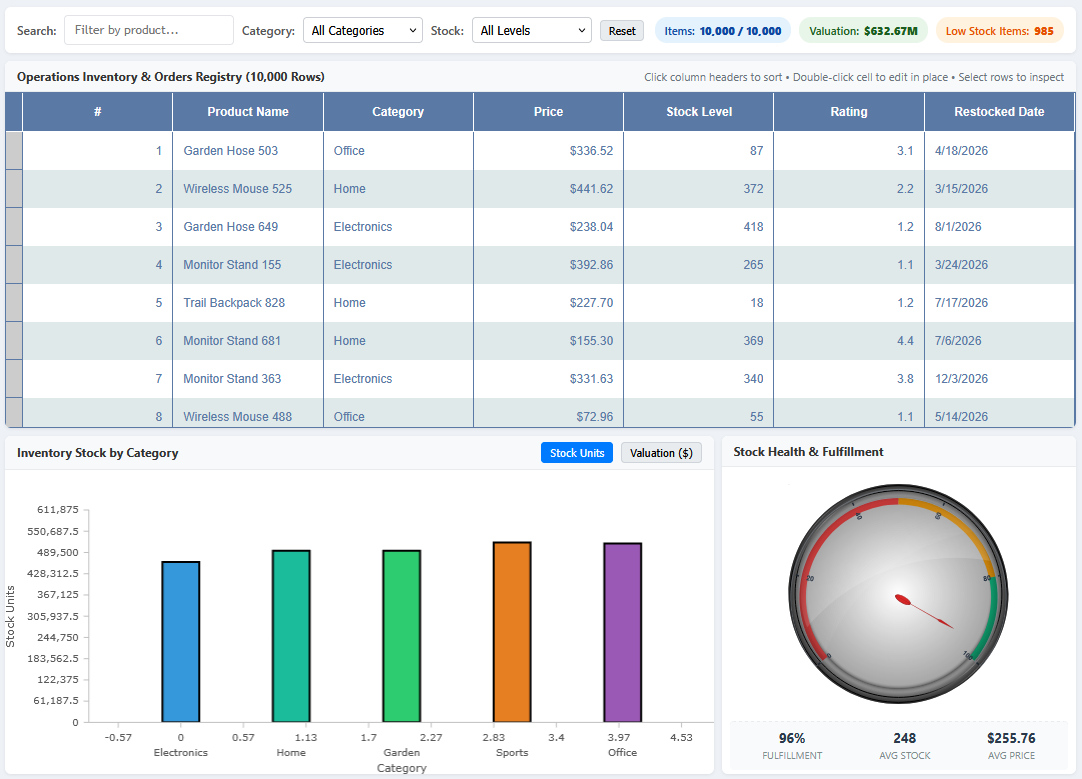
Our sample features the following components:
- MindFusion.DataViews (Grid): provides virtualized DOM rendering that handles 10,000 live rows with sorting, instant filtering, and inline editing.
- MindFusion.Charting: used to create an interactive bar chart that displays inventory stock units and financial valuation grouped by category.
- MindFusion.Gauges: the OvalGauge is customized to render a circular meter that indicas operational fulfillment rate with color-code zones according to stock availability.
- Dynamic Client-Side Dataset: A lightweight pseudo-random data generator producing 10,000 consistent records in ~18ms with no backend server required.
The full source code for this sample is available on Mindfusion JavaScript GitHub Repository: https://github.com/MindFusionComponents/JavaScript-Dashboard-Samples
Dashboard Architecture at a Glance
The dashboard uses the flex layout to arrange the DOM elements that are used by Mindfusion to render its components: Canvas elements for the chart and gauge and a DIV element for the data grid.
- Top Half (~50%): A full-width virtualized data grid with a search and filter toolbar.
- Bottom-Left (2/3 width): An interactive canvas bar chart comparing stock volume and gross inventory valuation across categories, complete with metric toggles.
- Bottom-Right (1/3 width): A dynamic gauge that indicates real-time fulfillment capacity alongside summary KPI stat cards.
+------------------------------------------------------------------------+
| Search & Category Filter Toolbar | Items: 10,000 | Valuation: $2.5M   |
+------------------------------------------------------------------------+
|                                                                        |
|  MindFusion DataViews (Grid): 10,000 Virtualized Rows                  |
|  [#] [Product Name] [Category] [Price] [Stock] [Rating] [Restocked]    |
|                                                                        |
+---------------------------------------------------+--------------------+
|  MindFusion Charting (BarChart)                   | MindFusion Gauges  |
|  Inventory Stock & Valuation by Category          | Fulfillment Health |
|  [Stock Units] [Valuation ($)]                    | (OvalGauge: 0-100%)|
|  [==============================================]  | [ KPI Stat Cards ] |
+---------------------------------------------------+--------------------+
Step 1: Lightweight Client-Side Data Generation (data.js)
To demonstrate high-volume performance without requiring backend databases or multi-megabyte JSON payloads, we implemented a deterministic, seedable PRNG using the mulberry32 algorithm:
// data.js
function mulberry32(a) {
  return function () {
    a |= 0; a = a + 0x6D2B79F5 | 0;
    let t = Math.imul(a ^ a >>> 15, 1 | a);
    t = t + Math.imul(t ^ t >>> 7, 61 | t) ^ t;
    return ((t ^ t >>> 14) >>> 0) / 4294967296;
  };
}


const categories = ["Electronics", "Home", "Garden", "Sports", "Office"];
const names = ["Desk Lamp", "Monitor Stand", "Trail Backpack", "Garden Hose", "Wireless Mouse"];

function generateOrders(count, seed = 42) {
  const rnd = mulberry32(seed);
  const rows = [];
  for (let i = 1; i <= count; i++) {
    rows.push({
      ID: i,
      Product: names[Math.floor(rnd() * names.length)] + " " + (100 + Math.floor(rnd() * 900)),
      Category: categories[Math.floor(rnd() * categories.length)],
      Price: Math.round((5 + rnd() * 495) * 100) / 100,
      Stock: Math.floor(rnd() * 500),
      Rating: Math.round((1 + rnd() * 4) * 10) / 10,
      Restocked: new Date(2026, Math.floor(rnd() * 12), 1 + Math.floor(rnd() * 28))
    });
  }
  return rows;
}
Generating 10,000 structured inventory records takes less than 18 milliseconds on modern browsers thus we have an instant launch of the sample loaded with data and no lag time on start.
Step 2: The Virtualized Data Grid (MindFusion.DataViews)
Standard HTML tables or naive grid components struggle once data volumes exceed a few hundred rows. MindFusion.DataViews uses DOM virtualization, rendering only the rows and cells currently visible inside the viewport.
Configuring Typed Columns
Each column is typed (IntegerType, StringType, LookupType, CurrencyType, RealNumberType, DateType), granting built-in data formatters, natural sorting algorithms, and the built-in inplace editors:
var dv = MindFusion.DataViews;
var columns = [];

// index
var colId = new dv.GridColumn("ID");
colId.dataType = dv.IntegerType;
colId.caption = "#";
colId.editable = false;
colId.sortable = true;
columns.push(colId);

// product name
var colProduct = new dv.GridColumn("Product");
colProduct.dataType = dv.StringType;
colProduct.caption = "Product Name";
colProduct.editable = true;
colProduct.sortable = true;
columns.push(colProduct);

// category - uses a dropdown
var colCategory = new dv.GridColumn("Category");
colCategory.dataType = dv.LookupType;
colCategory.caption = "Category";
colCategory.editable = true;
colCategory.sortable = true;
colCategory.metaData.set("values", categories.map(c => [c]));
columns.push(colCategory);

// price - format is currency
var colPrice = new dv.GridColumn("Price");
colPrice.dataType = dv.CurrencyType;
colPrice.caption = "Price";
colPrice.editable = true;
colPrice.sortable = true;
columns.push(colPrice);

// stock level - integer
var colStock = new dv.GridColumn("Stock");
colStock.dataType = dv.IntegerType;
colStock.caption = "Stock Level";
colStock.editable = true;
colStock.sortable = true;
columns.push(colStock);

// rstock data with date-time picker
// ... (attached similarly)

// initialize and bind the grid
var grid = new dv.Grid(document.getElementById("grid"));
grid.theme = "business";
grid.model = new dv.ArrayModel(allOrders, columns, "ID");
grid.allowEdit = true;
grid.allowCellSelect = true;
grid.render();
- Sorting: Click any column header to sort ascending or descending.
- Inline Editing: Double-click any cell to edit values directly with type-appropriate controls (e.g., datepicker calendar for dates, dropdown menus for categories, and formatted inputs for numbers).
Step 3: Executive KPI Gauge (MindFusion.Gauges)
For our operational KPI, we track the Fulfillment Rate, which is the percentage of catalog items with sufficient stock on hand.
We use an OvalGauge with custom arc angles and colour-coded operational zones:
var Gauges = MindFusion.Gauges;
var gauge = Gauges.OvalGauge.create(document.getElementById("gauge"), false);

var scale = new Gauges.OvalScale(gauge);
scale.minValue = 0;
scale.maxValue = 100;
scale.startAngle = 140;
scale.endAngle = 400;
scale.fill = "transparent";
scale.stroke = "#cbd5e1";
scale.scaleRelativeRadius = 0.68;
scale.scaleRelativeCenter = new MindFusion.Drawing.Point(0.5, 0.52);
scale.margin = new MindFusion.Drawing.Thickness(0.14, 0.14, 0.14, 0.14);

// operational zones
function addZone(min, max, color) {
    var range = new Gauges.Range();
    range.minValue = min;
    range.maxValue = max;
    range.fill = color;
    range.stroke = "transparent";
    range.startWidth = new Gauges.Length(6, Gauges.LengthType.Relative);
    range.endWidth = new Gauges.Length(6, Gauges.LengthType.Relative);
    scale.addRange(range);
}

addZone(0, 50, "#ef4444");   // critical - low stock (red)
addZone(50, 80, "#f59e0b");  // moderate capacity (amber)
addZone(80, 100, "#10b981"); // optimal fulfillment (green)

// pointer
var pointer = new Gauges.Pointer();
pointer.pointerWidth = new Gauges.Length(62, Gauges.LengthType.Relative);
pointer.pointerHeight = new Gauges.Length(6, Gauges.LengthType.Relative);
pointer.shape = Gauges.PointerShape.Needle;
pointer.fill = "#dc2626";
pointer.stroke = "#991b1b";
scale.addPointer(pointer);
Whenever the dataset changes, we update the gauge needle the following way:
pointer.value = calculatedFulfillmentRate;
Step 4: The Reactive Bar Chart
The inventory bar chart summarizes data across categories (Electronics, Home, Garden, Sports, Office). It supports two modes:
- Stock Units: Physical count of units on warehouse shelves.
- Inventory Valuation: Gross dollar value calculated as Stock * Price.
var Charting = MindFusion.Charting;
var chartCanvas = document.getElementById("barChart");
var chart = new Charting.Controls.BarChart(chartCanvas);

chart.barLayout = Charting.BarLayout.SideBySide;
chart.barSpacingRatio = 2;
chart.showLegend = false;
chart.xAxis.title = "Category";
chart.yAxis.title = "Stock Units";

function updateChart(categoryData, isValuationMode) {
    var catValues = [];
    var catLabels = [];
    var brushes = [];

    categoryList.forEach(category => {
        var item = categoryData[category];
        var val = isValuationMode ? Math.round(item.valuation) : item.stock;
        catValues.push(val);
        catLabels.push(category);
        brushes.push(new MindFusion.Drawing.Brush(categoryPalette[category]));
    });

    // data labels displaying values under each bar
    var barLabels = new MindFusion.Common.Collections.List(
        catValues.map(v => isValuationMode ? "$" + (v / 1000).toFixed(1) + "k" : v.toLocaleString())
    );

    var barSeries = new Charting.BarSeries(
        new MindFusion.Common.Collections.List(catValues),
        null,
        barLabels,
        new MindFusion.Common.Collections.List(catLabels)
    );
    barSeries.supportedLabels = Charting.LabelKinds.XAxisLabel;

    // add 18% headroom on Y-Axis so top labels never clip
    var maxVal = Math.max(...catValues);
    chart.yAxis.minValue = 0;
    chart.yAxis.maxValue = Math.ceil(maxVal * 1.18);
    chart.series = new MindFusion.Common.Collections.ObservableCollection([barSeries]);

    // apply palette brushes per element
    var seriesBrushes = new MindFusion.Common.Collections.List();
    seriesBrushes.add(new MindFusion.Common.Collections.List(brushes));
    chart.plot.seriesStyle = new Charting.PerElementSeriesStyle(seriesBrushes);

    chart.draw();
}
Step 5: Connecting the Dots — Bi-Directional Interactivity
The real power of our operations dashboard is that all its components respond dynamically to every user interaction in real time:
1. Instant Filtering (grid.filter)
MindFusion Grid provides a functional filter callback that executes on data evaluation without creating duplicate array clones:
function applyFilters() {
    var searchVal = searchInput.value.trim().toLowerCase();
    var catFilter = categoryFilter.value;
    var stockFilterVal = stockFilter.value;

    grid.filter = function (rowIdx, srcModel) {
        var row = srcModel.getRowData(rowIdx);
        if (!row) return false;

        if (catFilter && row.Category !== catFilter) return false;

        var stock = Number(row.Stock) || 0;
        if (stockFilterVal === "low" && stock >= 50) return false;
        if (stockFilterVal === "optimal" && (stock < 50 || stock > 300)) return false;
        if (stockFilterVal === "high" && stock <= 300) return false;

        if (searchVal && row.Product.toLowerCase().indexOf(searchVal) === -1) {
            return false;
        }

        return true;
    };

    updateDashboard(); // Recalculates metrics and redraws chart & gauge!
}
2. Bi-Directional Chart Clicking
Clicking a bar on the chart automatically filters the grid to show only products in that category:
chart.dataItemClicked.addEventListener(function (sender, args) {

    if (args && args.index !== undefined) {

        var clickedCategory = categoryList[args.index];

        categoryFilter.value = (categoryFilter.value === clickedCategory) ? "" : clickedCategory;

        applyFilters();

    }

});
3. Row Selection & In-Line Edits
- When a row is selected (grid.rowSelected), the chart highlights that item's category and dims the others.
- When any cell is modified inline (grid.rowUpdated), inventory totals recalculate immediately, moving the gauge pointer and adjusting bar heights on the fly.
Key Performance Takeaways
- Zero Server Overhead: The entire dashboard runs 100% in the client's browser.
- Instant Virtualization: 10,000 rows scroll at a steady 60 frames per second because only the visible ~25 rows reside in the active DOM tree at any given moment.
- Pixel-Perfect Scaling: Using proper flexbox constraints and dynamic canvas buffer sizing (fitChartCanvas(), fitGaugeCanvas()), the layout adapts gracefully to full HD monitors, laptop screens, or mobile viewports without clipping.
Try It Yourself
Run online https://mindfusion.dev/javascript-demo.html?sample=OperationsDashboard
Download the sample: https://mindfusion.dev/samples/javascript/applications/OperationsDashboard.zip
You can explore the live code, clone the project, or integrate MindFusion components into your own applications:
- Download MindFusion JsPack Free Trial: https://mindfusion.dev/javascript-pack.html
- GitHub Corporate Repository: https://github.com/MindFusionComponents/JavaScript-Dashboard-Samples
- Online Documentation & Component Samples: https://mindfusion.dev/docs/javascript/pack/Introduction_19.htm
Have questions or recommendations? Reach out on our Community Forum: https://mindfusion.dev/Forum/YaBB.pl?board=jschart_disc